This data page is being used to show you how much our school community uses products made by the companies (who we targeted) and also to prove the value of informing people about palm oil and sumatran tigers!
First, we surveyed the students to see how many students know of and used products made by: Mars, General Mills, and Nestle. Then we did a survey to see what the students knew about palm oil, Sumatra, Sumatran tigers, and more about this subject. Last, we went out to educate the students in grade K-5 about the palm oil crisis and surveyed them again to see if they learned anything new after our lessons.
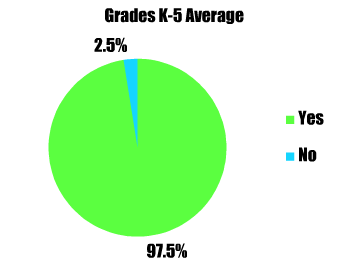
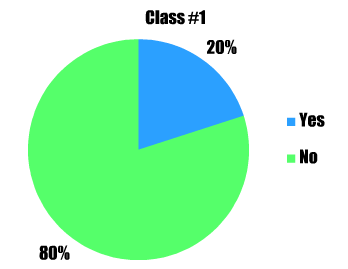
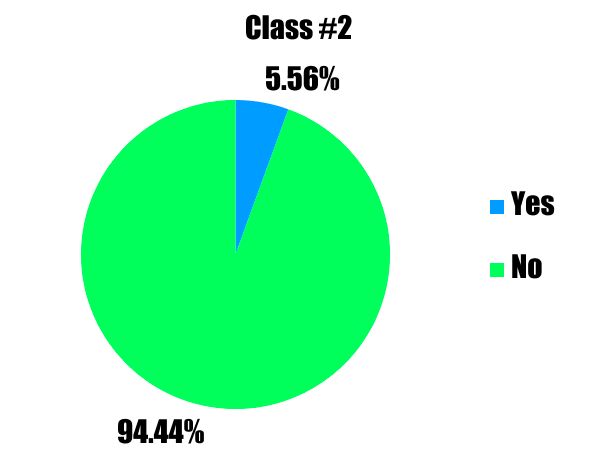
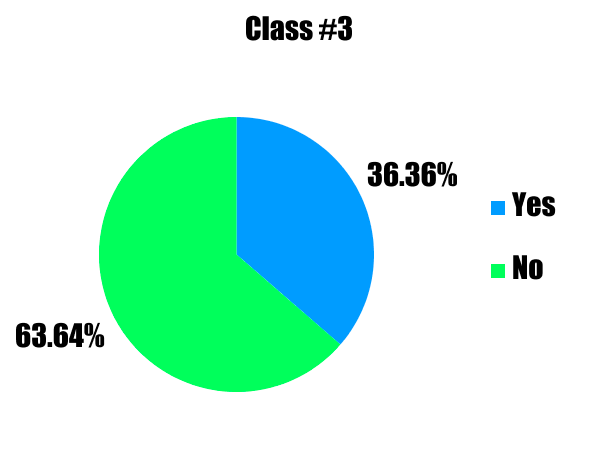
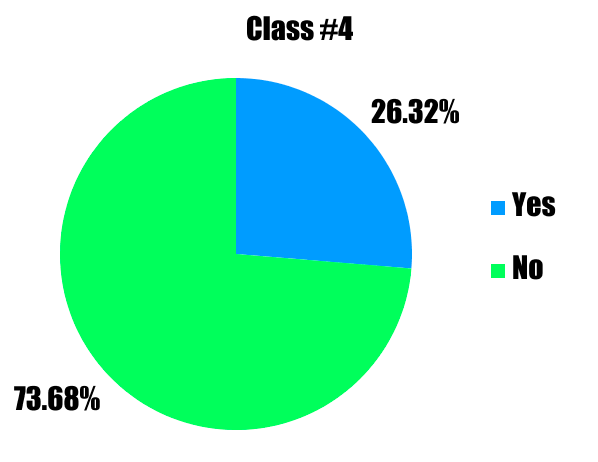
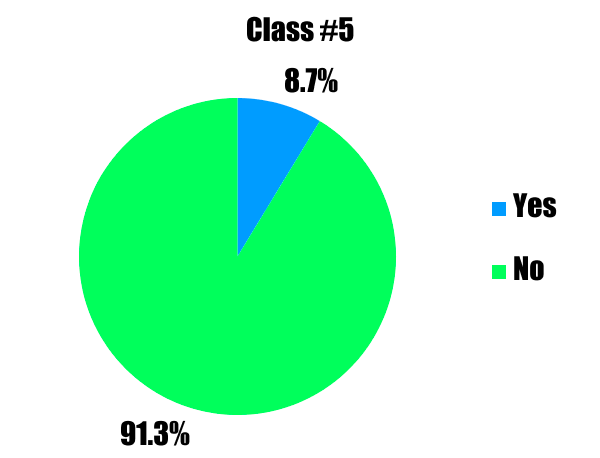
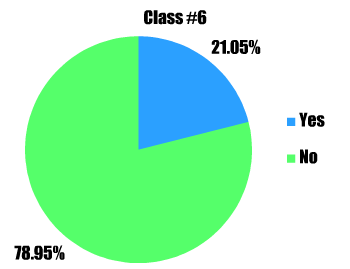
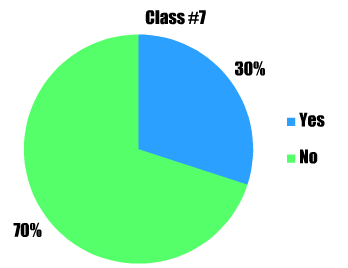
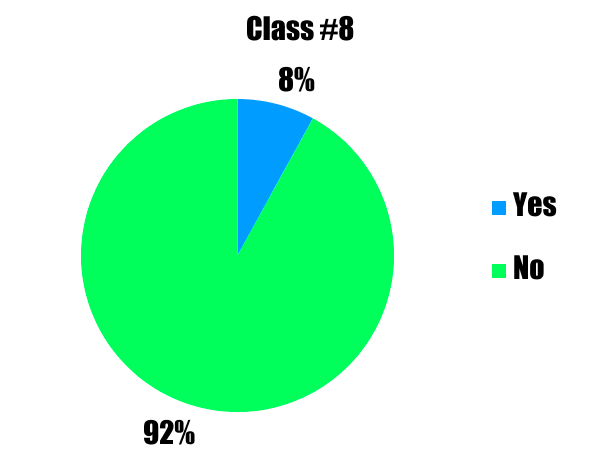
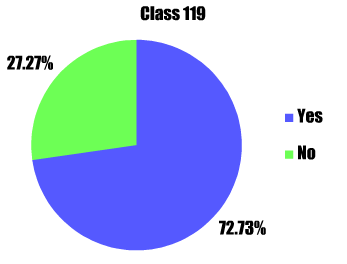
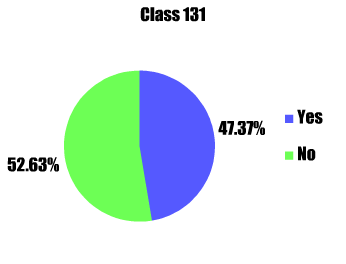
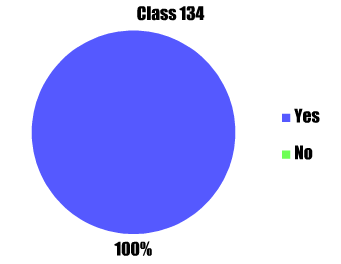
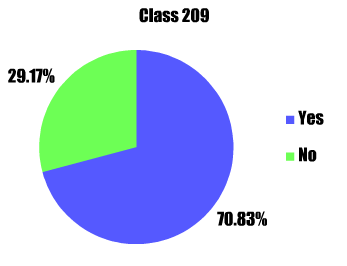
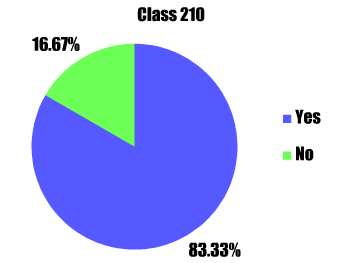
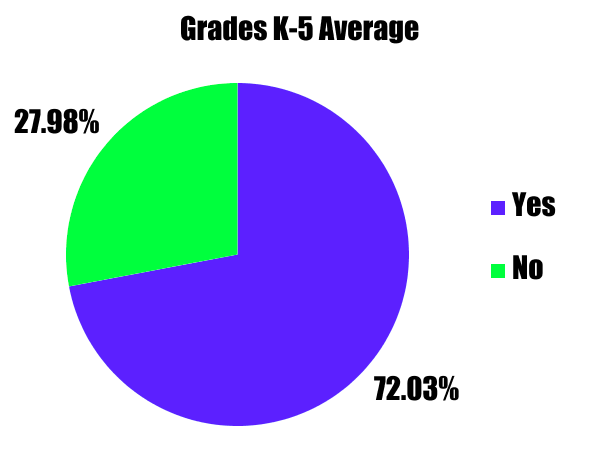
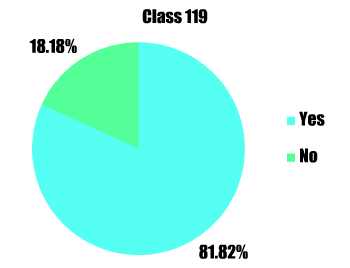
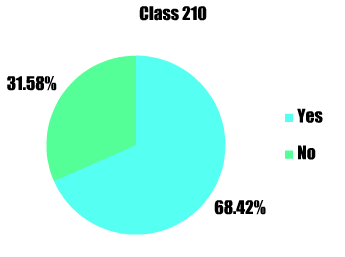
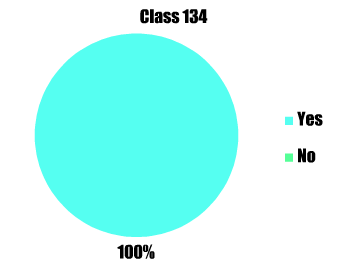
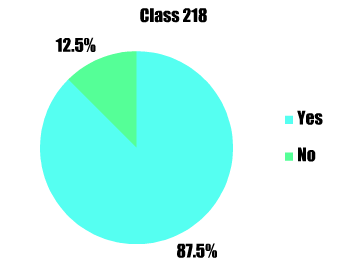
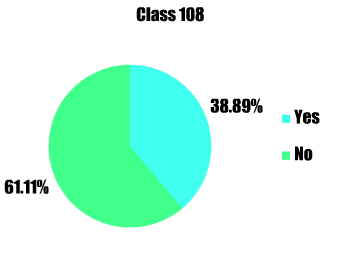
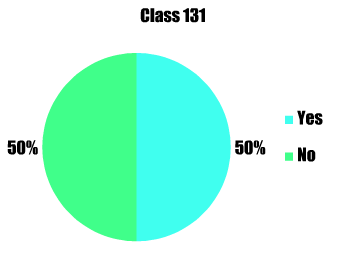
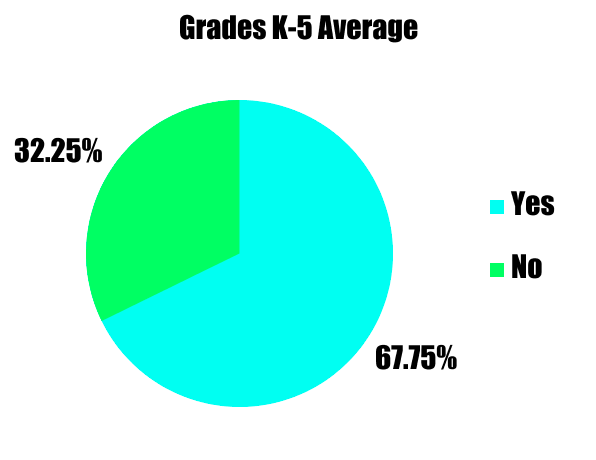
Below, you will see the data from grades K-5 as a result of the surveys we conducted. The following are "yes" or "no" questions that reflected the knowledge and awareness of the UNLESS Project, which also incorporated the information about Sumatran Tigers, Palm Oil, and the 3 companies in our campaign that use Palm Oil in their products.
1. Do you use regularly use products from Mars, General Mills, and Nestle?
2. Are you aware of the issues facing Sumatran Tigers and their habitat loss? (This question was asked before the 3 mini-lessons were given.)
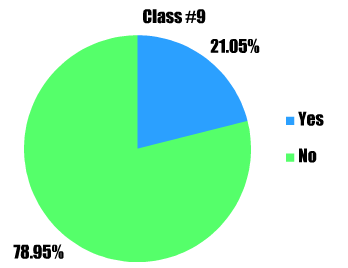

3. Are you aware of the problems that come with the usage of palm oil? (This question was asked after the 3 mini-lessons were completed.)
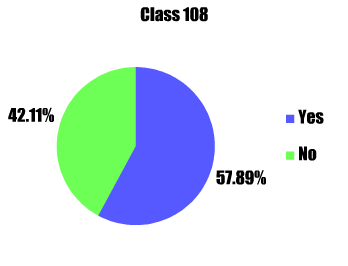
4. Do you think that companies like General Mills, Mars, and Nestle should find alternative substitute ingredients instead of using palm oil in their products?
Dreading The Data Collection, A Editorial by: Cheyenne Livingston
Making graphs for the UNLESS project was a tedious but rewarding task. The experience of collecting data was easy, but making the charts was the real challenge. Incomplete surveys, illegible handwriting, and unanswered questions, were the main factors in the struggles of making our data graphs. After multiple attempts to recollect data, our tasks were finally accomplished and we had enough data to complete the project. While making the graphs, we also faced technical problems that made our experience as a group that much harder. The graph’s were made by a moderate sized group of people who were solely dedicated to the completion of the data section of the UNLESS Project. Although we argued and bickered, we tried our hardest to make the best out of what we had to work with. I wouldn’t change any of the things we did, because our project was crafted with precision and thoughtfulness.
Making graphs for the UNLESS project was a tedious but rewarding task. The experience of collecting data was easy, but making the charts was the real challenge. Incomplete surveys, illegible handwriting, and unanswered questions, were the main factors in the struggles of making our data graphs. After multiple attempts to recollect data, our tasks were finally accomplished and we had enough data to complete the project. While making the graphs, we also faced technical problems that made our experience as a group that much harder. The graph’s were made by a moderate sized group of people who were solely dedicated to the completion of the data section of the UNLESS Project. Although we argued and bickered, we tried our hardest to make the best out of what we had to work with. I wouldn’t change any of the things we did, because our project was crafted with precision and thoughtfulness.